Adding Runecast to my Grafana monitoring
Firstly a disclaimer:-
This post is 100% my own opinion and it is not emphasising that you should use this with the Runecast product and that they are currently my employer at the time of writing this article. It is not supported or endorsed by Runecast and I would always suggest using the inbuilt dashboards. Jorge just knows that I love a good Grafana dashboard, I have written a few for in house monitoring systems along with the irony of my home automation monitoring. It’s just a nice way to keep up to date on one of my screen in my office especially when I was working with remote teams
First things for you need a copy of Runecast so do go register over here https://portal.runecast.com/registration and it’s a great time to schedule a call with our team so they can show you the true potential of the product too 🙂 It can save you hours in upgrades and also assist you with keeping your environment in great shape to support you and your users in preventing outages. If you are a vExpert do not forget to head over here
Right with that over onto the install steps, this also assumes you have a Ubuntu 20.04 LTS that you can use to run this on and you may not already have an InfluxDB or Grafana instance anywhere. Again Jorge is a god at these things and has a full guide here but I only want the barebones to demo this off but do follow the telegraf part if you want to monitoring
Firstly you want to SSH into your Ubuntu host are run the below commands
(sudo wget -qO- https://repos.influxdata.com/influxdb.key | sudo apt-key add -
source /etc/lsb-release
sudo apt-get install -y apt-transport-https
sudo apt-get install -y software-properties-common wget
echo "deb https://repos.influxdata.com/${DISTRIB_ID,,} ${DISTRIB_CODENAME} stable" | sudo tee /etc/apt/sources.list.d/influxdb.list
wget -q -O - https://packages.grafana.com/gpg.key | sudo apt-key add -
echo "deb https://packages.grafana.com/oss/deb stable main" | sudo tee -a /etc/apt/sources.list.d/grafana.list
sudo apt update
sudo apt-get install grafana jq influxdb
sudo service influxdb start
sudo systemctl start grafana-server)
Now we have that done what we need to do is create a database, user and password. If following the Telegraf bits you will already have this
curl -XPOST "http://localhost:8086/query" --data-urlencode "q=CREATE USER GrafanaDemo WITH PASSWORD 'SuperS3cur3P@a$$word' WITH ALL PRIVILEGES"
curl -post 'http://localhost:8086/query' --data-urlencode "q=CREATE DATABASE RunecastStats"
influx
show databases
quit
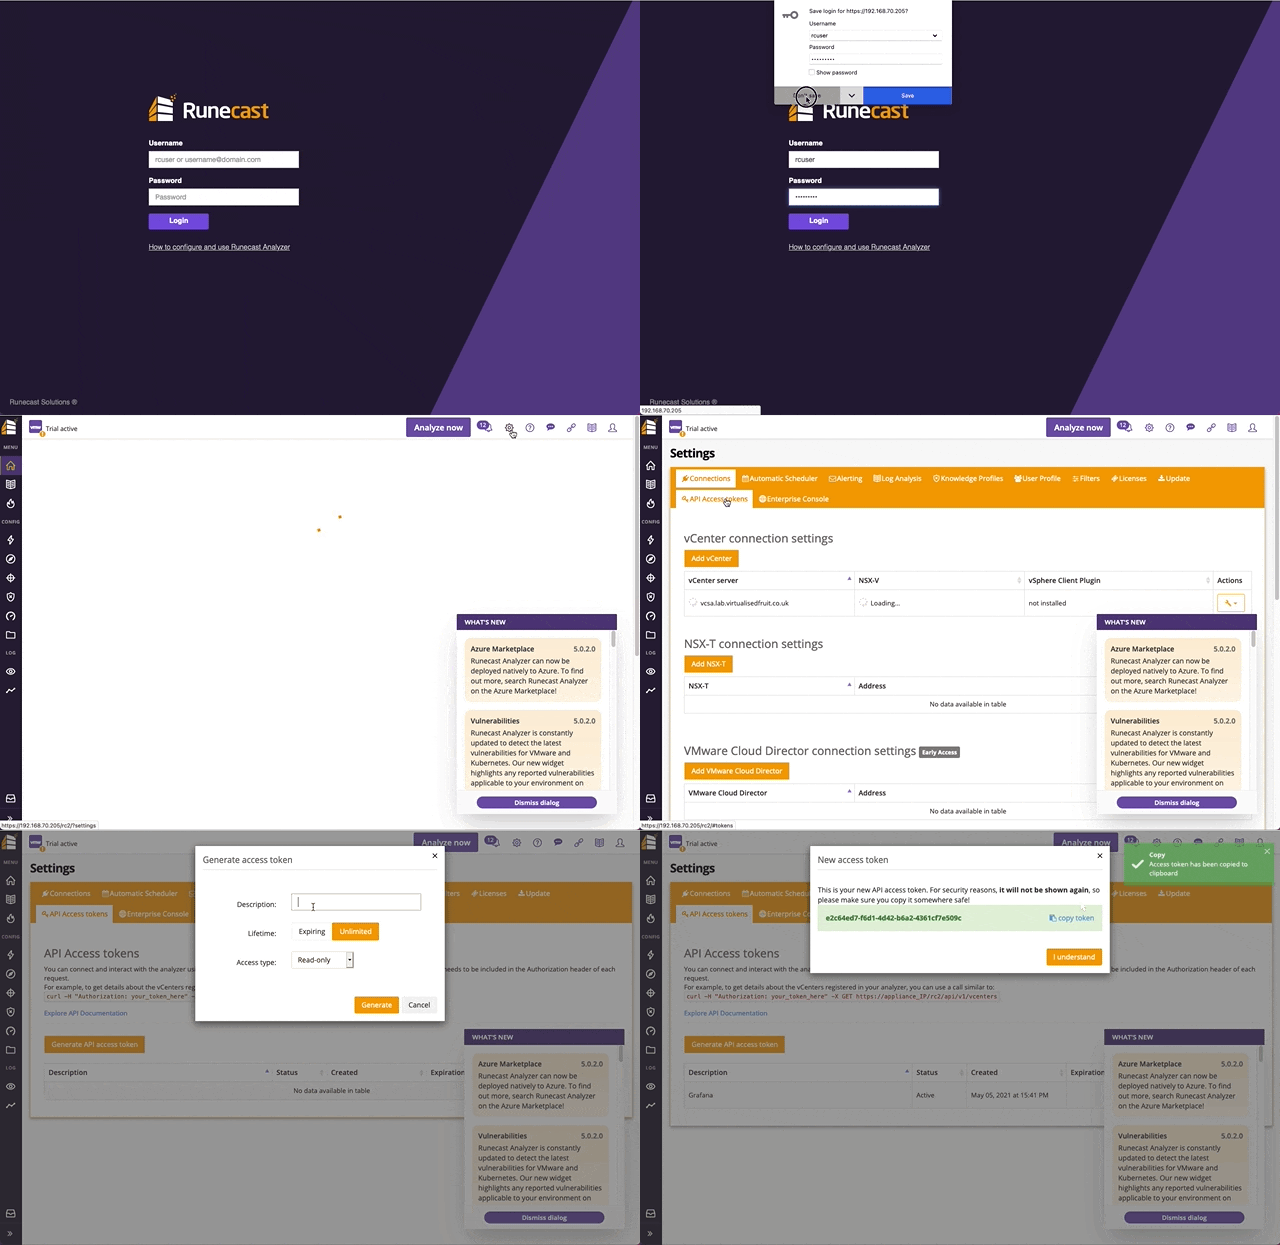
Now we need to go get a read only API token from Runecast. We can do this by logging into your appliance, then pressing the cog, in here select API Access Tokens and then Generate API Access Token. Keep this somewhere safe as it will not be shown again
What we now need to do is grab the script that will pull the stats and modify it for our needs
wget https://raw.githubusercontent.com/jorgedlcruz/runecast-grafana/main/runecast_grafana.sh
sudo nano runecast_grafana.sh
Edit the parts you need from the below
##
# Configurations
##
# Endpoint URL for InfluxDB
InfluxDBURL="http://YOURINFLUXSERVER" #Your InfluxDB Server, http://FQDN or https://FQDN if using SSL
InfluxDBPort="8086" #Default Port
InfluxDB="telegraf" #Default Database
InfluxDBUser="INFLUXUSER" #User for Database
InfluxDBPassword='INFLUXPASS' #Password for Database

# Endpoint URL for login action
runecastToken="RUNECASTOTKEN" #Your read-only Runecast token. You can quickly create one from the portal
runecastServer="RUNECASTFQDNORIP"
Save the file up and then make it an executable and give it a go!
chmod +x runecast_grafana.sh
./runecast_grafana.sh
Ignore my error its just a fresh install and I have not yet put a license on it 🙂
This script can take a long time to run depending on the size of your environment!
What need to do now is set up the Grafana instance so we can view this data, head to the IP or DNS name of your box on port 3000 http://ip:3000 the first login is admin / admin
You then need to select the cog on the left and then data sources, within here search for Influx and select it. In here put in the server as http://localhost:8086 and then your database and user details
Now we have this done lets get the dashboard downloaded and check it out! (Assuming the data has gone in!)
For this select the 4 squares and then manage, select import, from here type in ID 14213 and press load. Select the InfluxDB as your datasource and this it!
I know my dashboard is not showing issues, again this is all down to the fact its not got a full license for the purposes of this demo, you will also not see anything in the history for a few days so do not panic!
The last bit if there is data there is to add this to the crontab so it runs at a set time, you can do this by running the below to do it every 5 minutes
crontab -e
#Add the below
0 */6 * * * /home/oper/runecast_grafana.sh >> /var/log/runecast.log 2>&1
#Save and exit
sudo service cron reload
There is something still quite cool watching it run and count up though

Enjoy!


