
PernixData Freedom
I thought I would write a quick blog post about PernixData and their freedom product as I have used their full version in a POC and was blown away by the performance gains I got. Safe to say my expectations were high. The main reason that prompted me to use this was not only for the performance gain but it was also for the graphing that helps out with day to day performance monitoring which can help assist you in isolating any issues.
Firstly I know the two storage appliances we have in the environment that we were linking this to should have not been having the issues that we were experiencing but I wanted to get to the bottom of it. I was sure this was a networking issue or profile but our users were most upset and frustrated as their VDIs were slow. I know the one storage appliance being used to accelerate this work load should be able to do sub 2ms and lower performance but this was more in the region of 45ms!
The installation process was painless as always, upload a few package files to your local data store on your ESX hosts and enable SSH. From here follow the user manual for your version of ESX to install the VIB, one note here is make sure your host is in maintenance mode as I always forget. Give it a reboot and your ready for step 2. Installing the management server again was easy enough but the only hint I would provide here is if you are installing a separate SQL express instance ensure you pop into the SQL configuration tool and enable the named pipes and the TCP ports ensuring they both automatically started and are running. This isn’t configured as standard and usually causes a bit of head scratching into why the setup cant see the SQL instance thus slowing you don’t from RAM accelerated performanceness
Once you have done all your installs and rebooted hop yourself into the PernixData console, you of course will need to make sure you have pointed this at the right VMware cluster if you have a few. Now get ready to screenshot some baseline stats! I will elaborate on this more later on but the logs are only kept for 10 minutes so ideally you want to get the stats a few minutes after the product is in. Then try and get this during peak times such as log ons and off and repeat after a day or two. This really helps you analyse your baseline with some good solid ammunition to provide to your board/steering group into why you would upgrade to the full version if you do need write saving too. I say this from experience as I really wish I knew the magic number of what IO and latency this saved us as the product gets to work straight away within reason.
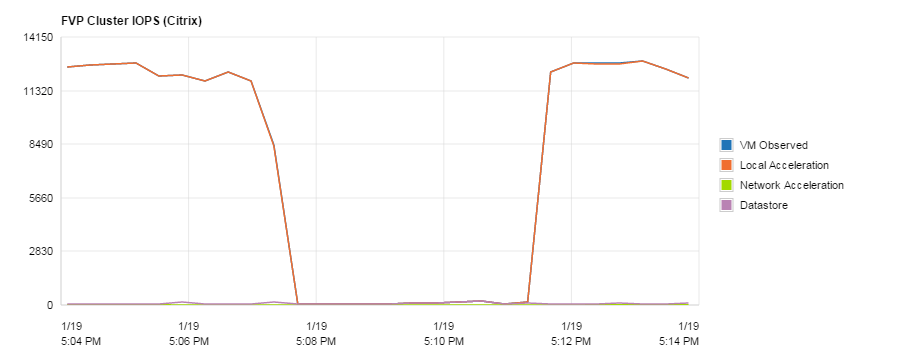
As you can see below this me logging into my non persistent desktop for the first time all bar the fact I got pushed to another VM as my old one was being rebuilt resulting in the storage spike

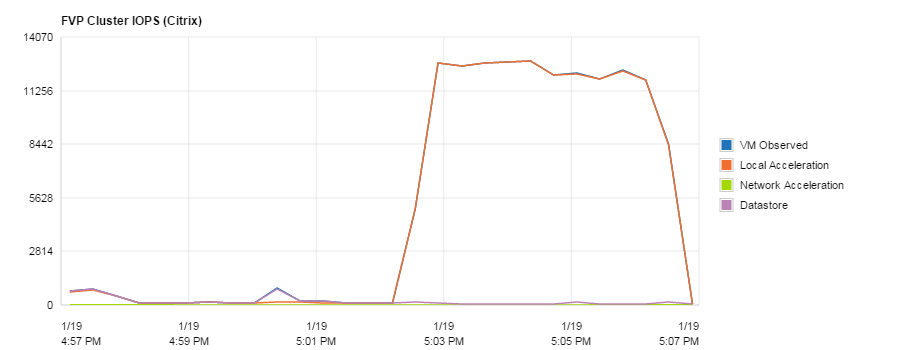
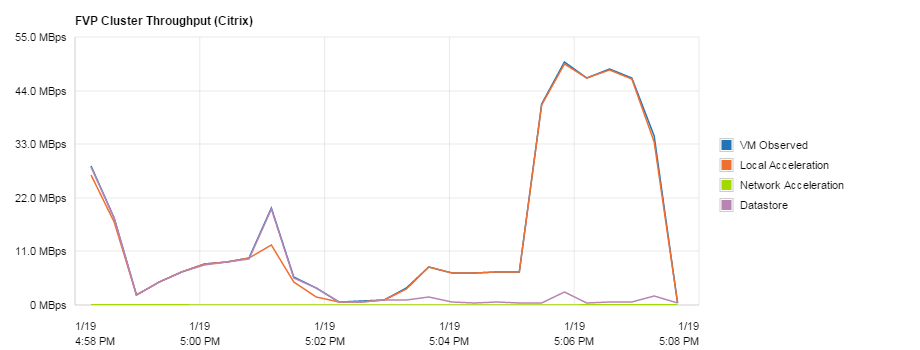
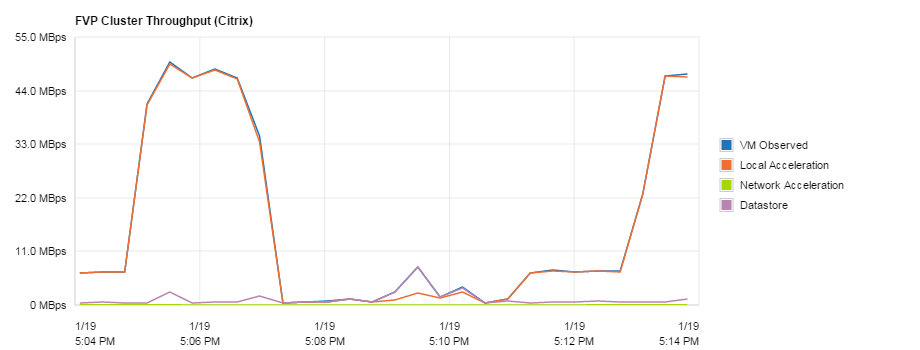
At this point I thought I would log on and off a few times to see if the performance got better and well yes it did. To try out my theory I tried a good old IOMeter test and well the results were more than surprising with the fact this product is FREE!!


As you can see I was pushing close to 4195 IOPS from one VM and this is what the VM Observed too, the best bit is the data store never really peaked above 500iops and latency was well within tolerance.
From here just don’t tell your users and wait till they see you making a coffee or better yet they may come to you with one asking how its got better. Once they have disappeared pop back to the dashboard and have a look at the savings! By day two on average we were now getting 2.6ms latency on our very busy VDIs and we saved nearly a TB of bandwidth in 2 weeks


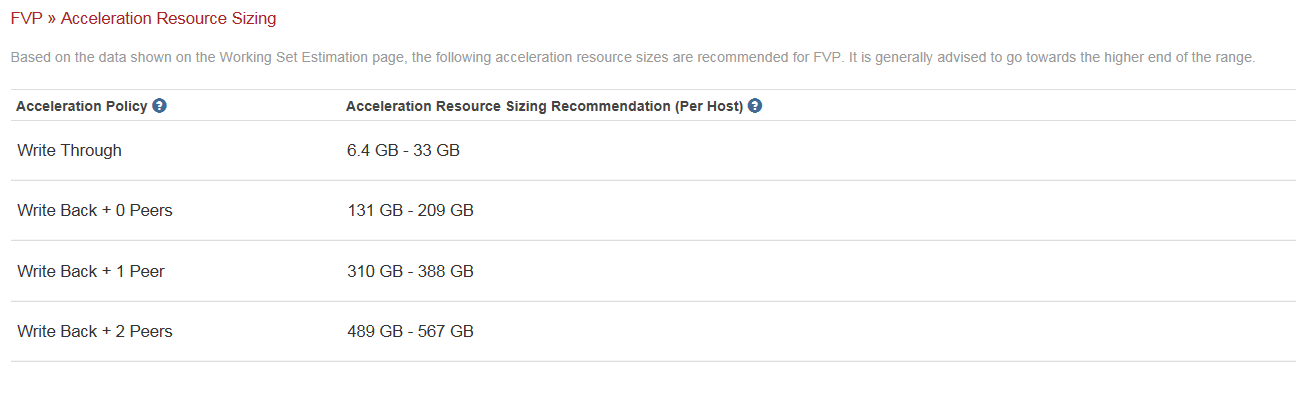
What happens if this isn’t enough?? Well all I can say is I suggest you also take advantage of the Architect trial available whilst you are setting this all up. Why you ask, I say easy response to that is that you get all the stats you need to justify ever upgrading if you need to. Within 8 hours it starts to provide some recommendations and even if you need to upgrade to the full version. As you can see from my screen shot I would benefit from this on two VMs as they have write heavy workloads . It also shows me what is going on with the block sizes just in case I have set some of these wrong.

It also takes a lot of the guess work out in sizing SSDs to get the best bang for your buck. As you can see if I am not too fussed about resiliency of which I wouldn’t be in this environment as they are non-persistent VDIs I should be able to get away with a 256gb SSD
So back to how this product has helped me isolate my issue, well on day 2 on the 19th once the product started to get used in anger I monitored the busy periods along with a few I created myself. As you can see around 11:08 the standard latency looks good all being sub 2 millisecond

I then decided to log on and off to rebuild my image


I also saw a little spike at lunch but this appeared to then go into the cache, maybe a bit of lunch time surfing caused this.

The next major hits were around 15:30, 16:30 and 17:30 when some of our users leave. Really worryingly I saw 580+ms latency at which point this is something to do with the network or our profiles copying across. The nice thing is you can do this at a per VM level to isolate the issue even further, I have removed the names of course from my screen shots. Maybe you just have one troublesome VM being a noisy neighbour

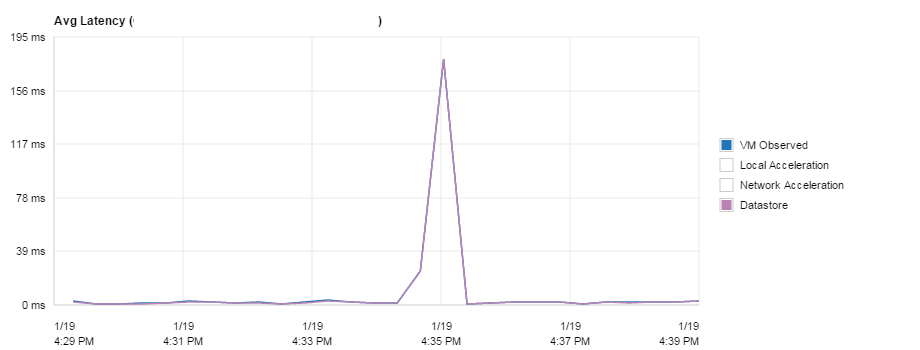


On a positive note the read cache limited the impact to two of our busiest persistent desktops sub 2ms again!


During this time I got a little excited from the savings and decide to run some tests at the same time and all I can say is WOW, no impact to the other users and look at the performance I got.
Another massive plus is when I came to log off my VDI and there had already been other log off processes of which had been put into the cache and the latency had dropped. Nowhere near the 445ms from some VMs earlier

By this point I appreciate this is a dry read and you are probably bored and just want the facts
What we are running this on:-
HP Bl460 Gen 9 – 256GB RAM in each host
Nimble CS215
HP 4730 Lefthand 2 x Nodes (on 10GB)
Xendesktop 7.6
Mix of Windows 7,8,10 clients to try and diagnose performance issues
VMware 5.5
Pros:-
- Its free!!! Not many things are in the IT world
- You can use up spare RAM if you have it
- Users get a better experience
- The stats help you isolate peak issue times to see if it’s a data store/networking issue or even just one VM
Cons:-
- The logs don’t run for long enough, 10 minutes just isn’t enough. Users never tell you when the issue occurs unless they are very frustrated
- Cant use SSD for now
- The overall limit really makes this product a sweet spot for 3 hosts only maxing out at 128GB cache.
So would I implement this product again? Put simply yes, yes I would. I’d question why wouldn’t you? Its free and when not many things in the IT world are and your users will get some form of better experience why wouldn’t you. This could be a DBA report running a bit better, VDIs being accelerated on login and maybe even their mailboxes just being a little more responsive if you put this on Exchange.
Top Tip Check List:-
- Just get on and install it!
- Work with your DBA and get the database configured in advance. Tell him he may get better performance
- Install the Architect trial from day 1 and get those stats! This may make it an easy sell to get the full product from the board/steering group
- Get a cup of tea and enjoy the latency drops = happier users and a few less support calls
I am still looking at the back end and verifying the gold build and network as I now know its not the storage causing this issue directly. I am sure this is something to do with the roaming profiles as I know both the storage appliance we are using can perform much better than they are. Basically Pernix Freedom has kept my users happy, me happy and given me more time to find the root cause without any impact.
I am hoping to compare this to their full product over the coming weeks once I can get a separate lab up and running to cross compare results.
Update:- Just thought I would add a video as I still can’t believe it myself. I know this isn’t real world data but if it can do this it should be able to cope with a fair amount of users all logging in and reading data from an image!
Disclaimer:- These views are my own personal views and do not represent the views of my current or past employers and/or partners


One Comment
Stewart Harding
This is a great article. Thank you for sharing this with me on Twitter. 🙂